
Performance Marketing
Why Blended MER Is Replacing Platform ROAS for Scaling D2C Brands
Learn why blended MER is now replacing platform ROAS, how to calculate your break-even MER, and build a D2C measurement stack you can trust.

Add up the revenue each ad platform claims, and you will often get a number far larger than your actual sales. If your dashboards say you are winning while your bank balance says otherwise, you have an attribution problem, not a marketing problem.
That is exactly why Blended MER Is Replacing Platform ROAS as the north-star metric for serious D2C brands. In this guide, you will learn what MER is, why platform ROAS keeps misleading founders, how to calculate your break-even MER, and how to build a measurement stack you can trust. Whether you sell from Surat, Austin, London, Toronto, Sydney, or Berlin, the math works the same way.
What Is Blended MER (and How Is It Different From ROAS)?
Marketing Efficiency Ratio (MER) is total revenue divided by total marketing spend across every channel, for the same period.
Platform ROAS is different. It is the revenue a single ad platform claims divided by what you spent on that platform.
Platform ROAS: Meta says 4.2x, Google says 5.1x, and TikTok says 3.4x.
Blended MER: Your Shopify revenue divided by your total ad and creative spend. It might be 2.6x.
Each platform grades its own homework. MER grades the whole business against one source of truth: your revenue.
Why "Blended ROAS" and MER Are Often Used Together
You will hear "blended ROAS" and MER used interchangeably. The calculation is the same: total revenue over total marketing spend. Many teams also track new-customer MER (nMER), which isolates revenue from first-time buyers, since repeat purchases can flatter your numbers.
Why Platform ROAS Is Breaking Down
Platform ROAS was never perfect. Several shifts have made it far less reliable for scaling brands.
- Privacy changes: After Apple's App Tracking Transparency rollout, industry trackers such as Flurry reported that only about a quarter of users worldwide opted in to tracking. That left large blind spots in platform data.
- Attribution overlap: Meta, Google, and affiliates can each claim credit for the same sale. The totals rarely reconcile with actual orders.
- Modeled conversions: Platforms now fill data gaps with estimates. Estimated data is not the same as cash in your account.
- View-through credit: A customer who scrolled past an ad can still be counted as a conversion, even if they were already planning to buy.
The result: a campaign can look profitable inside Ads Manager while quietly losing money once you factor in margins, returns, and shipping.
For a deeper look at how we approach channel-level measurement, explore our services page.
The Case for Blended MER as Your North Star Metric
Rising acquisition costs make accurate measurement non-negotiable. Widely cited industry analyses show customer acquisition costs for e-commerce brands have climbed substantially over the past several years. When every rupee, dollar, or pound counts, you cannot rely on a metric the seller of the ad inventory controls.
Here is why MER earns its place.
- It is hard to manipulate. Revenue comes from your store, not a platform's model.
- It captures halo effects. A TikTok video may drive a branded Google search. MER credits the whole system.
- It guides budget decisions. You can scale spend and watch whether total efficiency holds.
- It simplifies reporting. Founders, CFOs, and agencies all read the same number.
How to Calculate Your Break-Even MER
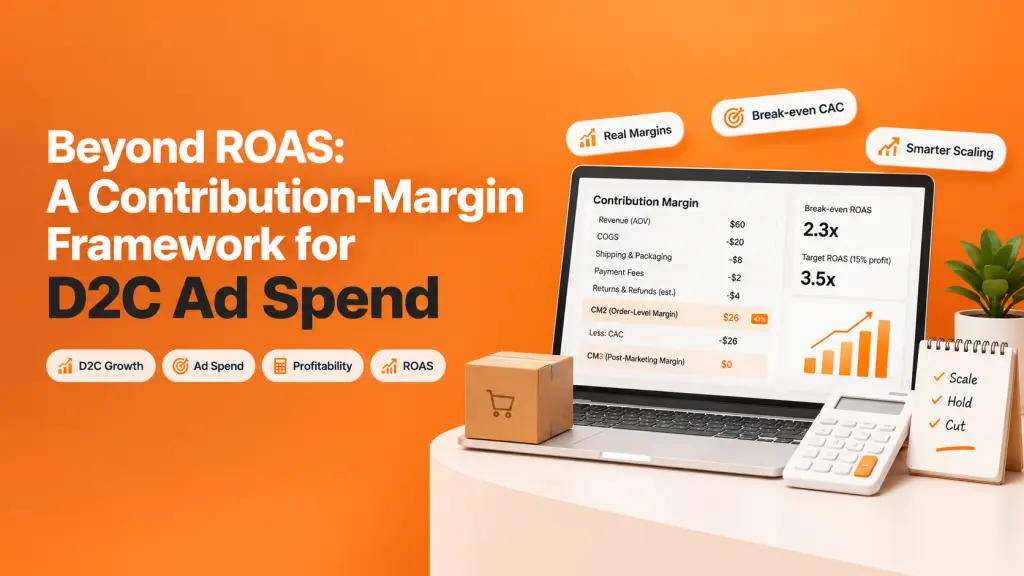
This is where MER becomes actionable. Your break-even MER depends on gross margin.
For example, if your gross margin after COGS, shipping, and payment fees is 60%, your break-even MER is 1 ÷ 0.60, or roughly 1.67. Anything above that is contribution profit before overheads.
Use this simple framework:
- Calculate contribution margin per order after product cost, fulfillment, and returns.
- Set your break-even MER from that margin.
- Set a target MER above break-even to cover overheads and growth.
- Review weekly, not daily, to avoid reacting to noise.
Brands with strong repeat purchase rates can sometimes run closer to break-even on first orders. Our team documents how this plays out in real accounts on our evidence page.
What Smart D2C Teams Do: A Practical MER Measurement Stack
MER does not replace platform data. It sits above it. Here is how high-growth brands layer their measurement.
Level 1: The Source of Truth
Track daily total revenue, total ad spend, and MER in a single dashboard connected to your store and ad accounts.
Level 2: Platform ROAS as a Directional Signal
Use in-platform ROAS to compare creatives and audiences within a channel. Do not use it to decide how much total budget you deserve.
Level 3: Incrementality Checks
Validate what is truly driving growth with the following tests.
- Geo-holdout tests: Pause spend in select regions and measure the revenue change.
- Post-purchase surveys: Ask customers "How did you hear about us?" to catch dark social and word of mouth.
- Spend-step tests: Raise budget by 20% and watch whether MER holds or drops.
Industry practitioners often cite post-purchase survey data as a useful cross-check against platform attribution, particularly for social and influencer-driven demand.
Where Platform ROAS Still Has a Role
Replacing a metric does not mean deleting it. Platform ROAS remains useful for:
- Comparing ad sets and creatives in the same account
- Spotting sudden performance drops
- Feeding platform learning with conversion signals
Think of it this way: MER decides how much to spend. ROAS helps decide where to spend it.
Common MER Mistakes to Avoid
- Ignoring margin: A 3x MER on a 30% margin product is a loss maker.
- Mixing in repeat revenue: Track nMER alongside MER to avoid inflated efficiency.
- Forgetting creative costs: Include production, influencer fees, and agency retainers in total marketing spend.
- Overreacting daily: Use seven-day or fourteen-day windows to smooth volatility.
Creative volume is often the real lever behind MER growth. Our insights hub covers creative testing and funnel strategy in more detail.
Frequently Asked Questions
What is MER in e-commerce?
MER (Marketing Efficiency Ratio) is total revenue divided by total marketing spend over the same period. It shows how efficiently your entire marketing budget generates sales, regardless of platform.
What is a good MER for a D2C brand?
A good MER sits comfortably above your break-even point, which equals 1 divided by your gross margin. Many D2C brands target between 2x and 4x, depending on margins and repeat purchase rates.
What is the difference between MER and ROAS?
ROAS measures revenue attributed to one ad platform against that platform's spend. MER measures total business revenue against total marketing spend, which avoids double-counted conversions.
Why is platform ROAS unreliable?
Privacy restrictions, modeled conversions, view-through attribution, and overlapping credit between platforms all inflate or distort platform-reported ROAS. Reported totals often exceed actual orders.
Should I stop using ROAS completely?
No. Use ROAS to compare creatives and campaigns within a platform. Use MER to set overall budgets and judge business-level profitability.
What is nMER?
nMER (new-customer MER) divides revenue from first-time customers by total marketing spend. It prevents repeat buyers from masking weak acquisition performance.
How often should I review MER?
Review MER weekly, with seven-day and fourteen-day rolling views. Daily swings are usually noise, especially for brands with longer consideration cycles.
Ready to Scale on Numbers You Can Trust?
Dashboards should help you grow profitably, not just look impressive. Global Surat helps D2C brands across India, the US, UK, Canada, Australia, and Europe build MER-first growth systems that combine SEO, performance marketing, web development, and AI creative.
Book a strategy consultation today and let us audit your attribution, define your break-even MER, and build a scaling plan around real revenue.
Start at Global SuratMake this useful