
Performance Marketing
Beyond ROAS: A Contribution-Margin Framework for D2C Ad Spend
Learn how to build a contribution-margin framework for D2C ad spend, set a true break-even CAC and ROAS, and scale campaigns on real profit.

A 4x ROAS can still lose you money. Most D2C dashboards celebrate revenue per ad dollar while ignoring what it costs to deliver, ship, and refund every order.
A contribution-margin framework for D2C ad spend fixes this by measuring what each order leaves in your pocket after variable costs. This guide shows you how to calculate it, set a real break-even CAC, and use it to decide when to scale, hold, or cut a campaign.
Why ROAS Fails as a Profitability Metric
ROAS divides revenue by ad spend. It says nothing about product cost, shipping, payment fees, discounts, or returns.
Two brands can report an identical 3x ROAS and have opposite outcomes. One sells 70% gross-margin skincare. The other sells 35% gross-margin apparel with heavy returns.
The pressure is growing. Industry analyses of D2C economics widely report that customer acquisition costs have risen several-fold over the past decade, and privacy changes have made platform-reported ROAS less reliable than ever. When your numerator is shaky and your costs are ignored, the metric stops guiding decisions.
Here is what ROAS leaves out:
- Cost of goods sold and packaging
- Shipping, pick-and-pack, and fulfilment fees
- Payment gateway fees (typically around 2 to 3% of order value)
- Returns, RTOs, and refunds
- Discounts and promo codes
What Is Contribution Margin in D2C?
Contribution margin is revenue minus all variable costs tied to an order. It tells you how much money is available to pay for marketing and, after that, fixed overhead and profit.
Most operators use three tiers:
CM1: Product-Level Margin
Net revenue minus COGS. This is your gross margin after discounts.
CM2: Order-Level Margin
CM1 minus shipping, fulfilment, payment fees, and expected returns. This is the number that sets your maximum ad spend.
CM3: Post-Marketing Margin
CM2 minus customer acquisition cost. If CM3 is negative on a first order, you are buying that customer at a loss and betting on repeat purchases.
For deeper reading on D2C unit economics, explore our latest insights.
How to Build Your Contribution-Margin Framework for D2C Ad Spend
Follow these three steps. The numbers below are an illustrative example, so swap in your own.
Step 1: Calculate CM2 Per Order
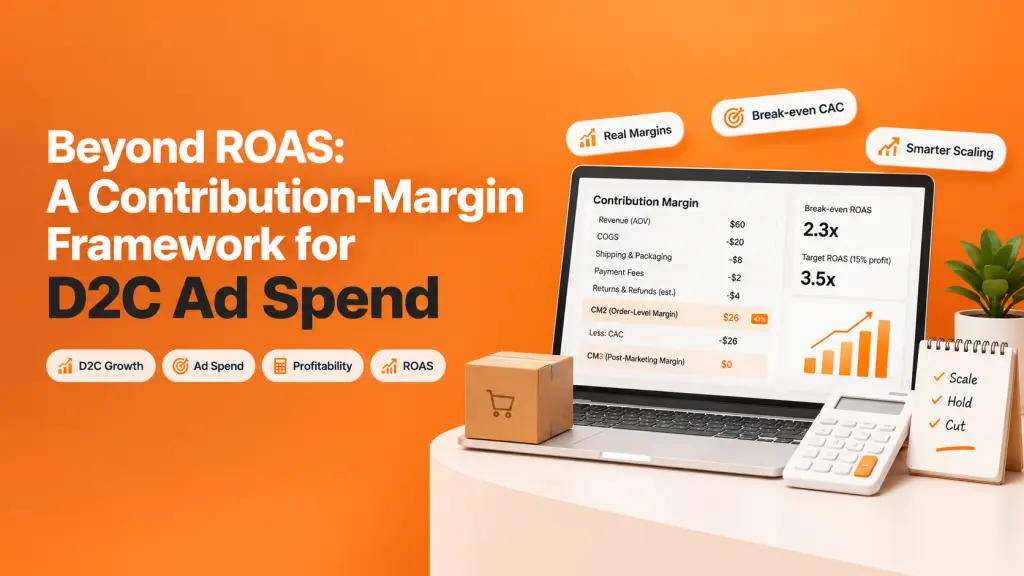
Assume an average order value of $60.
- COGS: $20
- Shipping and packaging: $8
- Payment fees: $2
- Expected returns and refunds: $4
CM2 = $60 - $34 = $26 (about 43%)
Your gross margin looks like 67%, yet only 43% is truly available for marketing. That gap is where “profitable” campaigns quietly bleed cash.
Step 2: Convert CM2 Into Break-Even CAC and ROAS
Your break-even CAC equals your CM2 per order: $26. Spend more than that to win a first order and you lose money on it.
Now translate it into ROAS:
Break-even ROAS = AOV / CM2 = $60 / $26 = 2.3x
- A margin-based guess from gross margin alone would suggest 1.5x, which is dangerously low
If you want 15% of revenue ($9) left as profit after ads, your allowable CAC is $17. That sets your target ROAS at about 3.5x.
Step 3: Segment Before You Scale
Blended numbers hide winners and losers. Calculate contribution margin by:
- Product or SKU, since margins and return rates differ widely
- Channel, such as Meta, Google, and marketplaces
- Customer type, new versus returning
- Geography and payment method
Brands that split campaigns by margin tier often find that a “low ROAS” hero product is quietly their most profitable line. See how we structure this kind of analysis in our evidence.
Contribution Margin Across Global Markets
Variable costs differ sharply by region, so your framework must too.
- India: Cash on delivery orders commonly carry RTO rates in the 20 to 30% range, which can erase margin fast. Model prepaid and COD separately.
- US and Canada: Free shipping expectations and return policies inflate fulfilment costs.
- UK and Europe: VAT, cross-border duties, and consumer return rights (such as the 14-day withdrawal window in the EU) cut into CM2.
- Australia: Long shipping distances raise logistics costs per order.
Apparel and footwear categories frequently see online return rates above 20%, so returns belong in your CM2 calculation from day one.
Using the Framework to Make Budget Decisions
Once you know your numbers, decisions get simpler.
- Scale campaigns where CM3 is positive on the first order
- Hold campaigns that break even on the first order but show strong repeat purchase behavior
- Cut or rework campaigns that fall below break-even ROAS with no retention upside
A new-customer acquisition budget can run at or slightly below break-even only if your 90-day repeat rate and LTV prove the payback. Pair contribution margin with cohort-based LTV, never with hope.
Our services team builds these dashboards alongside SEO, performance marketing, and creative, so spend decisions rest on real profit.
Common Mistakes to Avoid
- Using blended CAC that mixes organic and paid customers
- Ignoring returns until finance reports them months later
- Treating discounts as marketing instead of a margin deduction
- Updating costs annually rather than quarterly as freight and platform fees change
Frequently Asked Questions
What is a contribution-margin framework for D2C ad spend?
It is a method of setting ad budgets based on the profit left after all variable order costs, rather than on revenue alone. It produces a break-even CAC and a target ROAS tied to real margins.
Why is ROAS not enough for D2C brands?
ROAS ignores COGS, shipping, fees, and returns. A campaign can show a high ROAS and still lose money on every order.
How do you calculate break-even ROAS?
Divide your average order value by your CM2 per order. For example, a $60 AOV with $26 of CM2 gives a break-even ROAS of about 2.3x.
What is the difference between CM1, CM2, and CM3?
CM1 is revenue minus product costs. CM2 subtracts shipping, fulfilment, fees, and returns. CM3 subtracts customer acquisition cost.
What is a good contribution margin for D2C?
Many healthy D2C brands aim for a CM2 of 40 to 60% and a positive CM3 after acquiring new customers. Targets vary by category, AOV, and repeat rate.
How often should I update my contribution margin?
Review it monthly and recalculate fully each quarter, or whenever supplier costs, shipping rates, or return behavior change.
Can I run ads at a loss on the first order?
Yes, if cohort data shows strong repeat purchases and a clear payback window. Without that evidence, first-order losses are just losses.
Ready to Scale on Profit, Not Vanity Metrics?
Global Surat helps D2C brands across India, the US, UK, Canada, Australia, and Europe replace guesswork with margin-based growth. Book a strategy consultation and we will map your true break-even CAC, audit your ad accounts, and build a scaling plan around contribution margin. Start at globalsurat.com and see what profitable growth looks like.
Make this useful